For a growing service business, the most dangerous cost isn’t on any spreadsheet.
It’s the hidden cost of uncertainty — not knowing which projects are truly profitable and which are silently draining your resources.
Profit doesn’t disappear in a single event. It leaks slowly — through underestimated hours, unclear priorities, and invisible non-billable time. Managers feel it not in their reports, but in the quiet unease of not knowing whether growth is helping or hurting the bottom line.
We know that feeling well. Back in 2007, while running our own software development company, we faced the same frustration. We could code complex systems but couldn’t clearly see where our time and money were going. That struggle led us to build our own internal tracker — a small experiment that eventually became PlanArty.
This guide is built on what we’ve learned since then.
It offers a five-step framework to help service-based businesses move beyond guesswork, stop profit leakage, and gain full control over project profitability.
Let’s start by identifying where profit typically slips through the cracks — the three silent leaks that affect nearly every growing service team.
3 Signs Your Business Is Leaking Profit
Once you start managing multiple projects, clients, and team members, the challenge shifts from tracking time to understanding profitability.
Spreadsheets and manual reports can show how many hours were worked, but they can’t tell you where profit is leaking — or why.
Here are three signs that your service business might be losing money in ways that aren’t immediately visible..
1
When Data Entry Becomes a Time Sink
Each week, you collect timesheets from multiple employees, double-check them for accuracy, and re-enter the data into payroll or invoices. It feels manageable at first, but over time the hidden costs pile up — hours lost, errors multiplied, and payroll delayed.
Manual data entry might seem harmless, but it silently drains productivity and increases the risk of paying for time that doesn’t exist.
The result: your team spends more time managing data than delivering value.
2
When Reports Don’t Reveal the Whole Picture
Spreadsheets and manually filled-in reports can show how much time was worked — even broken down by activity — but they rarely connect that information to cost, revenue, or client value. You might see where hours were spent, but not whether those hours were profitable.
Without linking time directly to project budgets, billing rates, and actual costs, it’s impossible to see which contracts earn healthy margins and which quietly lose money.
This is where most profit leaks stay hidden — in plain sight, inside your data.
3
When Billing Becomes a Guessing Game
If your billing process relies on employees reporting hours manually, there’s a good chance some time is missed or misclassified. Even small errors add up to significant losses over the course of a year — and most of them go unnoticed.
Accurate client invoicing depends on precise, real-time data, not assumptions or estimates. When you can trust the numbers behind every invoice, you not only protect your revenue but also strengthen client confidence and long-term relationships.
These are common growing pains in every service business. The good news is that they’re all solvable — with the right system.
The Framework – 5 Steps to Project Profitability Intelligence
Spreadsheets can help you count hours — but they can’t show you what those hours are worth. As your business grows, the real challenge isn’t tracking time; it’s understanding how time, cost, and value connect across every project.
Profitability intelligence is the ability to see those connections clearly. It turns raw time data into actionable insight — revealing where your company earns, where it loses, and how to make every project more predictable and profitable.
Here’s a practical five-step framework you can start applying today to bring that clarity into your own business.
1
Step 1: Centralize Time Data
Why it matters:
Scattered data is the biggest silent profit leak in most service businesses. When each employee tracks hours differently — on spreadsheets, sticky notes, or emails — no one has the full picture.
Centralizing your data gives you one source of truth for all time entries, payroll information, and project details.
What problem it solves:
It eliminates duplication, missing hours, and inconsistent records. You can review one clean report instead of reconciling multiple sheets.
Actions you can take:
- Choose one standardized time tracking format for the entire team.
- Require all project hours to be logged daily, not weekly.
- Keep payroll data (hourly rates, overtime rules) in one shared document or system.
- Audit your records once a month to ensure consistency.
This simple discipline is the foundation of every profitable company: you can’t optimize what you can’t see.
2
Step 2: Categorize Time by Project and Client
Why it matters:
Not all hours are equal. Ten hours spent on a high-margin client can generate more profit than thirty hours on a poorly priced project.
If your time data isn’t linked to specific projects or clients, you can’t tell which contracts truly contribute to your bottom line.
What problem it solves:
You stop treating all work as “productive.” Instead, you learn which work is profitable.
Actions you can take:
- Add a “Project/Client” column to every time entry (even in Excel).
- Review weekly reports to see where most hours go.
- Compare the revenue per project with the total hours spent.
- Flag projects where time exceeds budget — these are your profit leaks.
Once you see this data, patterns emerge. You’ll identify which projects overrun, which clients demand more revisions, and which team members are consistently efficient.
3
Step 3: Define Billable vs. Non-Billable Work
Why it matters:
Teams often confuse being busy with being profitable. Meetings, internal reviews, and training may all be valuable — but they don’t generate revenue.
Separating billable from non-billable hours shows how much of your team’s effort actually earns money.
What problem it solves:
It prevents underbilling and highlights where your time investment doesn’t return income.
Actions you can take:
- Create clear definitions: what counts as billable, what doesn’t.
- Review weekly totals: what % of total hours are billable?
- Identify non-billable activities that can be shortened or automated.
- Communicate these boundaries to your team, so everyone understands how time translates to revenue.
A healthy ratio for service businesses is typically 70–85% billable time. Anything less deserves investigation.
4
Step 4: Review and Approve Hours Regularly
Why it matters:
Unverified data is unreliable data. Regular review prevents small errors from snowballing into payroll disputes or incorrect invoices.
Approval also creates accountability: when managers review time entries, employees take accuracy more seriously.
What problem it solves:
It reduces costly corrections and helps maintain trust between management, employees, and clients.
Actions you can take:
- Set a weekly approval rhythm — every Friday or Monday morning.
- Use color coding or flags to highlight missing or questionable entries.
- Keep a short comment log for clarifications (why extra time was needed, etc.).
- Encourage your team to self-check their entries before submission.
When approvals become routine, accuracy becomes culture.
5
Step 5: Connect Time Data With Financial Results
Why it matters:
Time tracking is only valuable if it tells you something about your business performance.
By linking time data with billing, payroll, and project budgets, you turn raw numbers into insight — a real picture of profitability.
What problem it solves:
You stop treating time tracking as admin work and start using it as a management tool.
Actions you can take:
- Create a monthly report comparing total billable hours vs. revenue collected.
- Analyze which projects deliver the best profit per hour.
- Estimate the real cost of payroll per client or project.
- Review the data before taking on new clients or quoting new prices.
This final step is where calculators end — and profitability intelligence begins.
When time, money, and performance are connected, you can make every decision with confidence.
In summary
Profitability intelligence is not a single tool; it’s a mindset.
It’s about turning time data into actionable business insight — and building a culture where every hour is respected, measured, and aligned with profit.
Put Theory into Practice: Your Free Project Profitability Calculator
Understanding the framework is the first step. The next is applying it.
To help you get started, we’ve created a Project Profitability Calculator — available in Google Sheets. Use it to analyze a recent project and see exactly where your time and money went — and what your real margins look like.
What you’ll get (for free):
- Track time, cost, and revenue for every project in one place.
- See which clients and projects deliver the best margins.
- Monitor your team’s billable utilization and efficiency trends.
- Visualize profit data instantly through built-in charts and dashboards.
- Step-by-step instructions inside the file
- Pre-filled demo data for quick testing
- Dashboard with automatic profit and utilization metrics
Get your free Project Profitability Calculator
How the Calculator Is Built
To make this worth your email address, we built a serious tool — not a toy spreadsheet.
The download includes a complete dashboard, pre-built reports, and a quick-start guide.
For those who want to see under the hood, here’s what’s inside:
Workbook Structure
Every tab has a clear purpose, linked by smart formulas for real-time updates:
- Dashboard – Key KPIs and charts summarizing project performance.
- Team – List of team members, roles, and internal cost rates.
- Clients – Directory of active clients for easy reference.
- Projects – Project list linked to clients, with budgeted hours and rates.
- TimeLog – Central place to record work hours (date, member, project, activity, billable?, hours).
- Calc – Automated engine that calculates cost, revenue, and profit for every line.
- Reports – Pivot tables for quick analysis (Profit by Project, Top Clients, Utilization).
- Utilization – Breaks down billable vs. available hours for each team member.
Core Formulas
Designed for clarity and flexibility:
=IFNA(XLOOKUP(...), ...)
=IF(Billable="Yes", Hours * Effective_Rate * (1 - Discount%), 0)
Every formula is transparent and editable — no hidden macros, no black boxes.
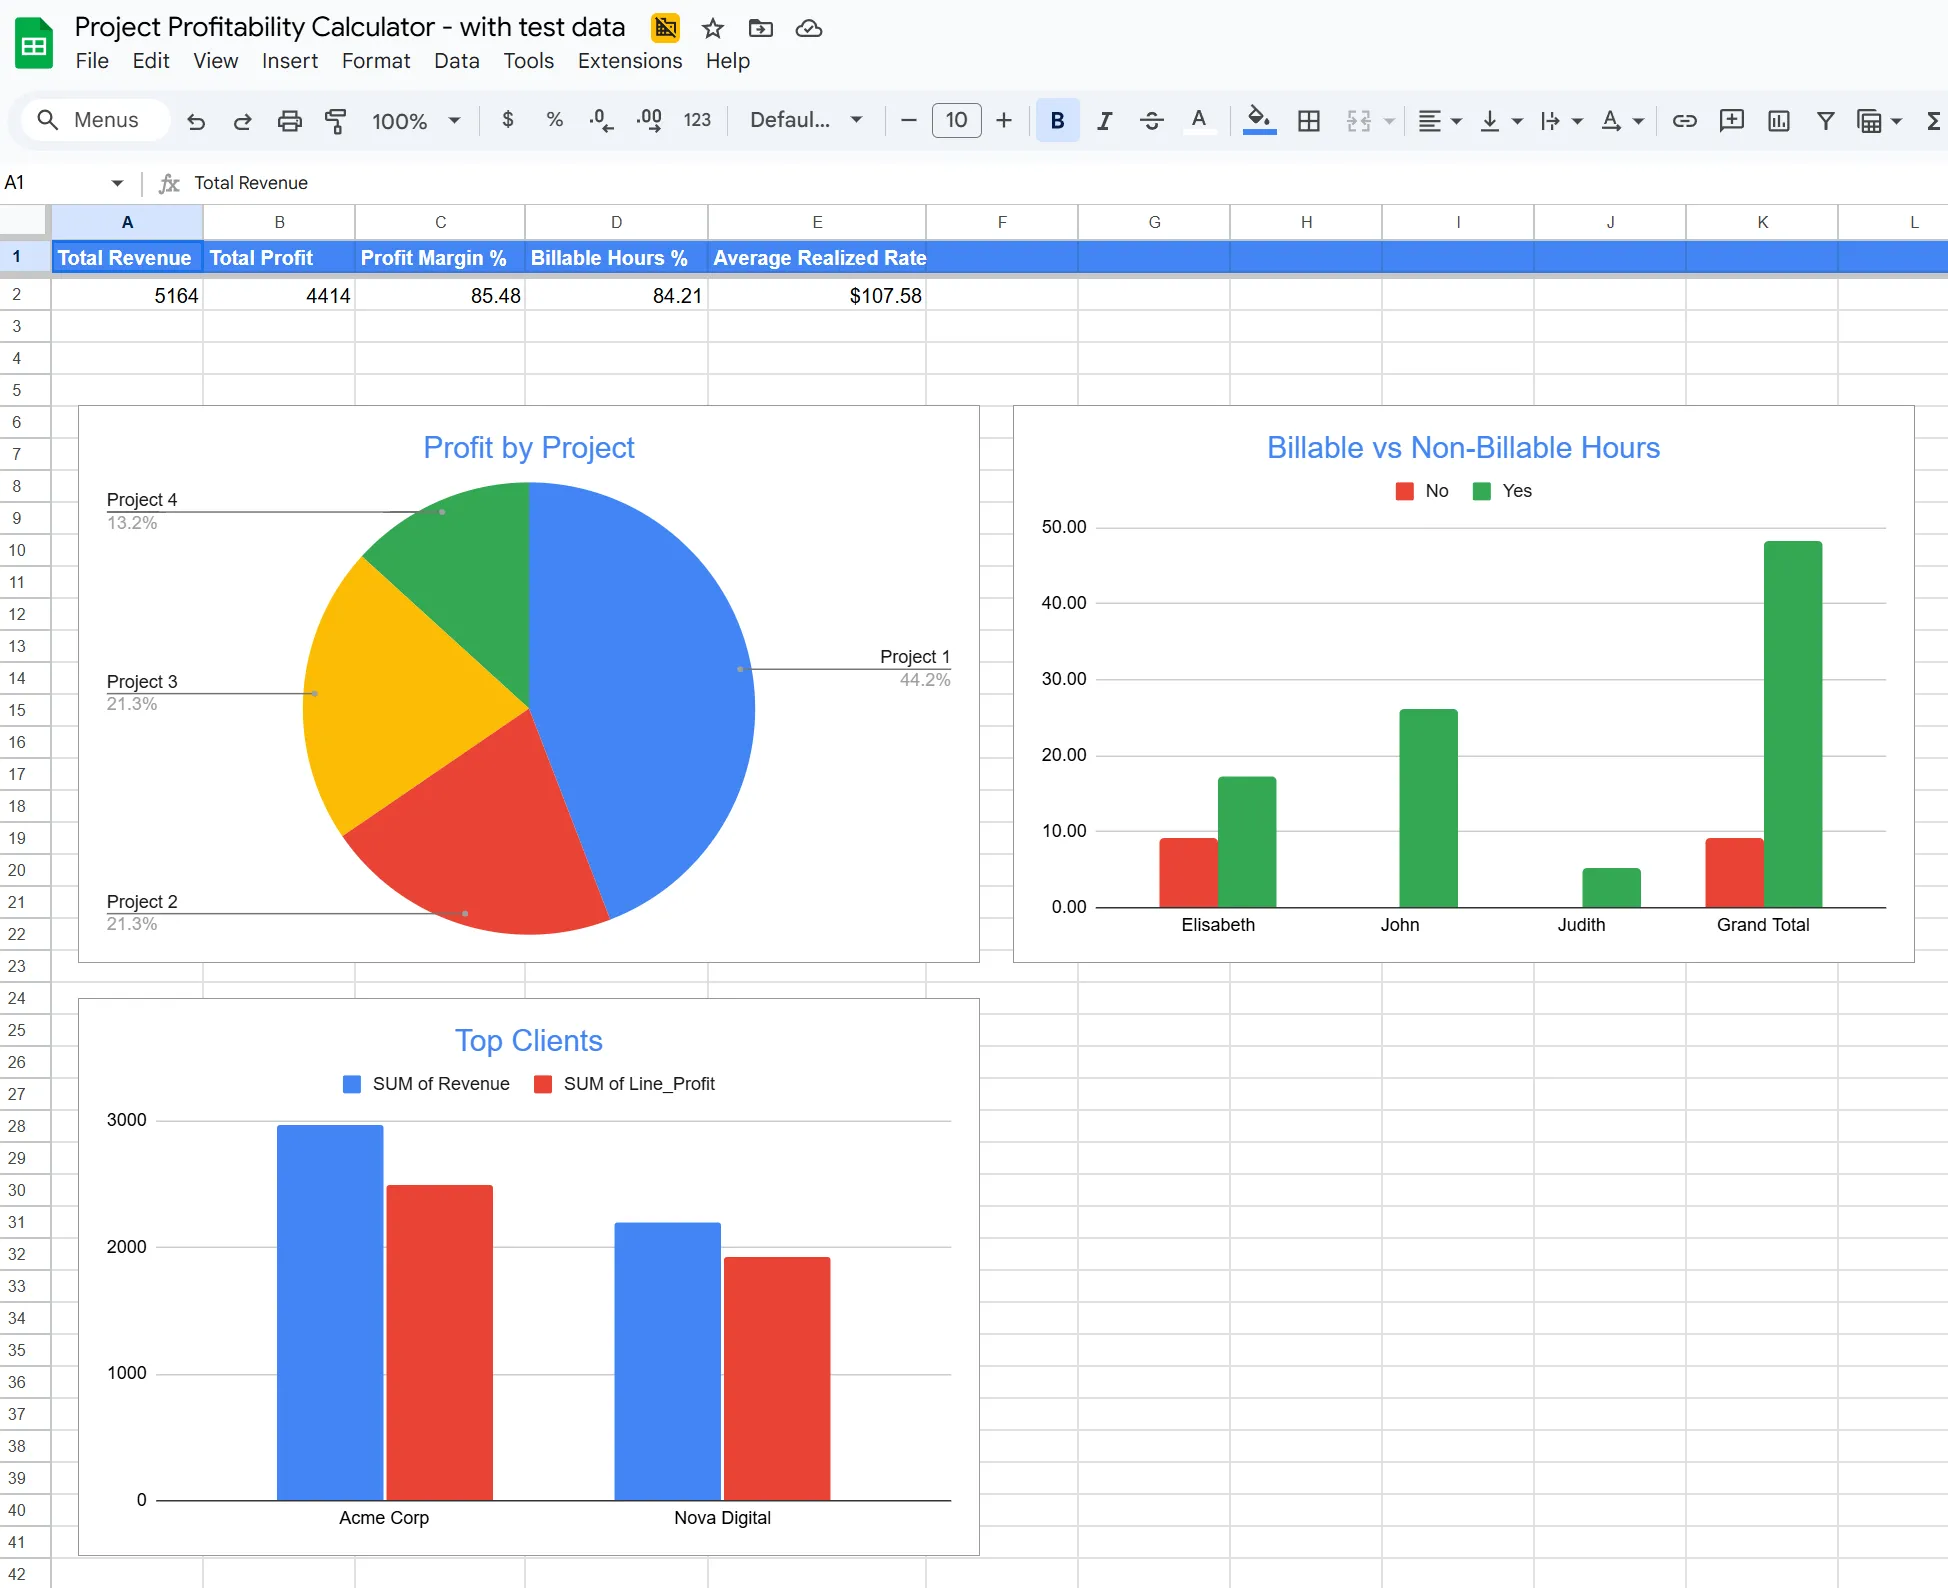
Dashboard Overview
The built-in dashboard displays:
- Total Revenue
- Total Profit & Profit Margin %
- Billable Hours % & Average Realized Rate
- Visual charts: Profit by Project, Top Clients, and Billable vs. Non-Billable Hours.
All visuals refresh automatically as you log time or adjust rates.
“What-If” Scenarios
The calculator includes editable parameters (hourly rates, discounts, overhead ratio) so you can instantly test profitability under different pricing or staffing scenarios — and see the impact in real time.
User Experience & Protection
To make it robust and safe to use:
- Formula sheets are locked to prevent accidental edits.
- Built-in guidance on each tab helps you navigate easily.
- Includes sample data so you can experiment safely before entering your own.
Frequently Asked Questions (FAQ)
What is project profitability and how do you calculate it?
Project profitability measures how much profit your business earns from each project after subtracting all related costs — including labor, overhead, and materials.
To calculate it, use the formula:
Project Profitability = (Project Revenue – Project Costs) ÷ Project Revenue × 100
A positive percentage means the project generated profit; a negative one indicates a loss. Tracking this regularly helps you see which projects contribute most to your bottom line and which ones need better pricing or scope control.
What is a good profit margin for a service business?
Profit margins vary by industry, but most healthy service businesses aim for 15–30% net profit per project.
If your margins are consistently below that range, review your pricing model, billable utilization rate, and internal overhead costs. Small improvements in time tracking accuracy or workload balance can significantly increase profitability over time.
How can I effectively track non-billable hours without hurting team morale?
Transparency and communication are key.
Explain to your team that tracking non-billable time isn’t about monitoring productivity — it’s about understanding workload balance and protecting profit.
Keep it simple:
– Track major non-billable categories only (e.g., admin, meetings, internal training).
– Use the data to improve processes, not penalize people.
– Share periodic insights with the team so they see the value of accurate reporting.
When employees understand why non-billable tracking matters, they’re more likely to do it consistently and accurately.
What is billable utilization and what should my target be?
Billable utilization shows the percentage of an employee’s total work hours that are billable to clients.
The formula is:
Billable Utilization = (Billable Hours ÷ Total Available Hours) × 100
A healthy target for most service teams is 70–85%.
Lower ratios may indicate too much time spent on internal work, while extremely high ratios (above 90%) often lead to burnout or declining quality. The goal is sustainable profitability, not constant overwork.
Conclusion: From Calculations to Clarity
Counting hours is easy.
Making those hours count — that’s where profitability intelligence begins.
Once you understand where time goes and how it affects budgets, payroll, and client value, your business moves from reacting to planning, from activity to control.
Visibility alone isn’t enough. True profitability requires connection — between time, cost, and outcome. When those elements work in sync, every decision becomes clearer, every project more predictable, and every hour more valuable.
That’s how smart managers build sustainable profit: not by tracking harder, but by seeing deeper.
Ready to See Your Business More Clearly?
Start your free, no-risk trial today. Get set up in minutes and see exactly where your time is going.
No credit card required • Cancel anytime